Water is a Fundamental Resource to Society
Without water, humans have days to live, crops can die, and a peaceful society can just grind to a halt.
There are two climate cycles in the Pacific Ocean that greatly affect the amounts of water California will have in its water reservoirs year to year. The better known climate cycle is the El Niño Southern Oscillation (ENSO), the other is the Pacific Decadal Oscillation (PDO).
Climate change can and will intensify these climate cycles. For California that can lead to years with much more intense droughts, and in other years, extremely heavy rainfall and aridification. In this blog post, let’s cover some of the basics of ENSO and PDO; and then follow up with their general effects on California’s water supply.
El Niño Southern Oscillation (ENSO)
The seas ranging from the coast of Peru stretch and as far west as Indonesia can warm or cool 1 to 3 degrees celsius over periods of about 3 to 7 years. The warm periods relate to El Ninos; the cool periods relate to La Ninas; and then lastly there are neutral phases which do not have strong warming or cooling. There are plenty of resources that cover ENSO in depth [1, 2, 3].
Pacific Decadal Oscillation (PDO)
The region which the Pacific Decadal Oscillation covers does have some overlap with ENSO, however it is also composed of a “horseshoe” shaped region in the northern hemisphere of the Pacific Ocean butting up against the North American continent. The PDO can stay in a “warm” or “cool” period of decades at a time.
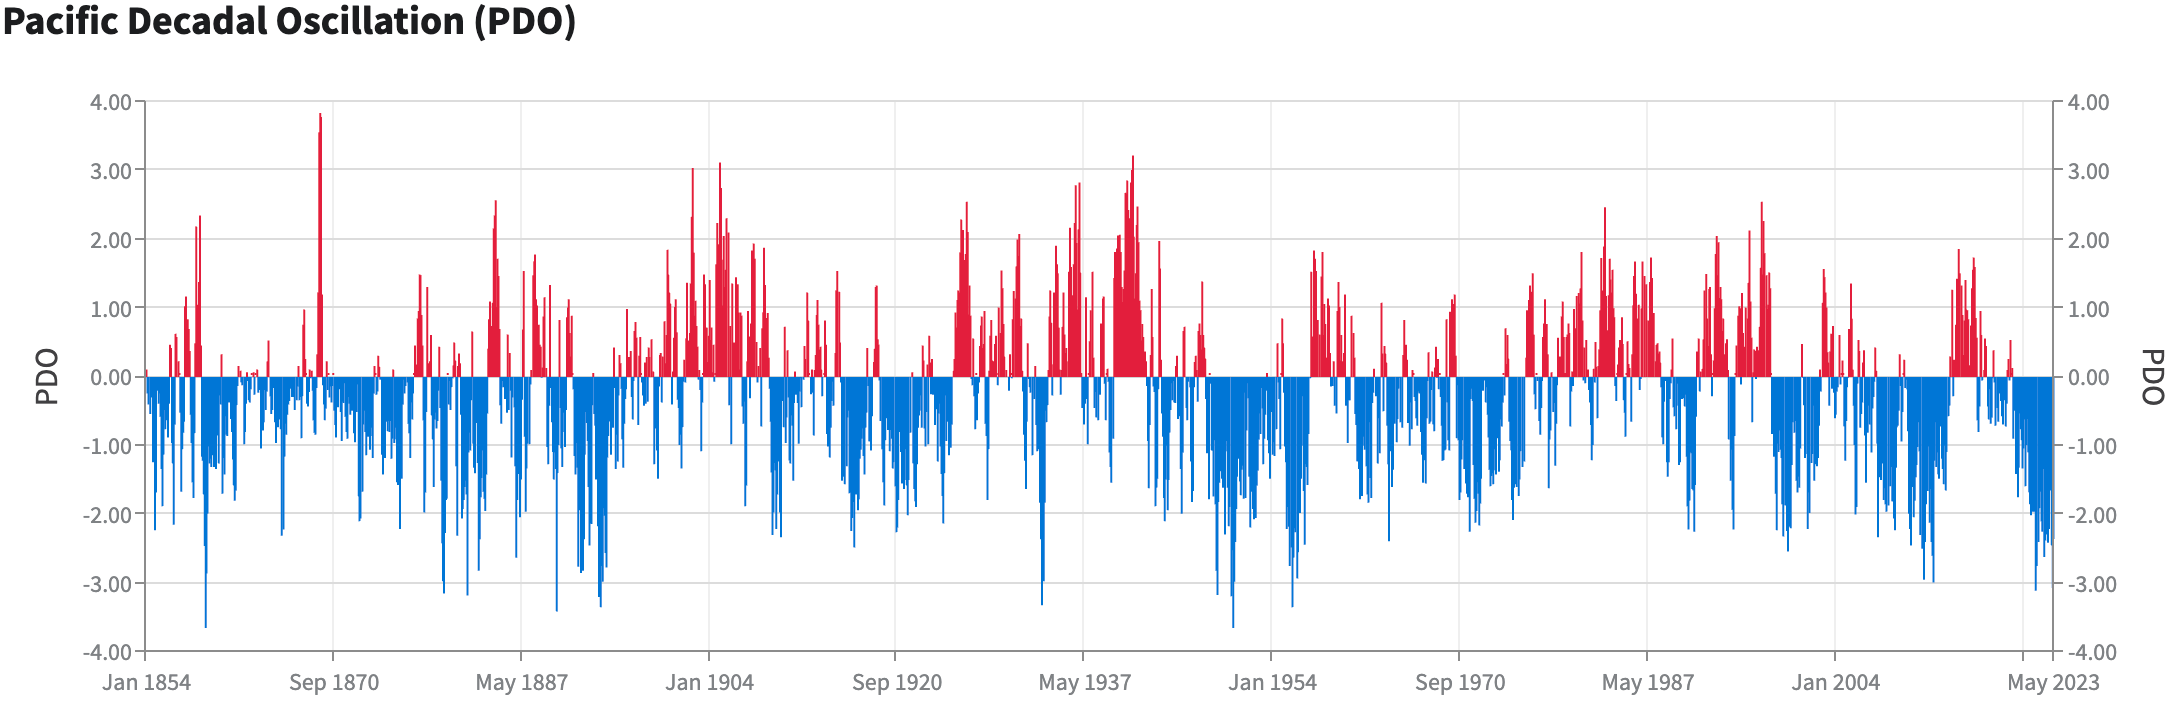
I will refer the reader to learn more about PDO in depth [4, 5, 6].
The Good Years and the Bad Years
The primary source of California’s water comes from the rains and snowpacks that flow into California’s watersheds and finally into the reservoirs. Let’s take a look at the following graph of the total amount of water in California’s water reservoirs from 1970 to 1990.
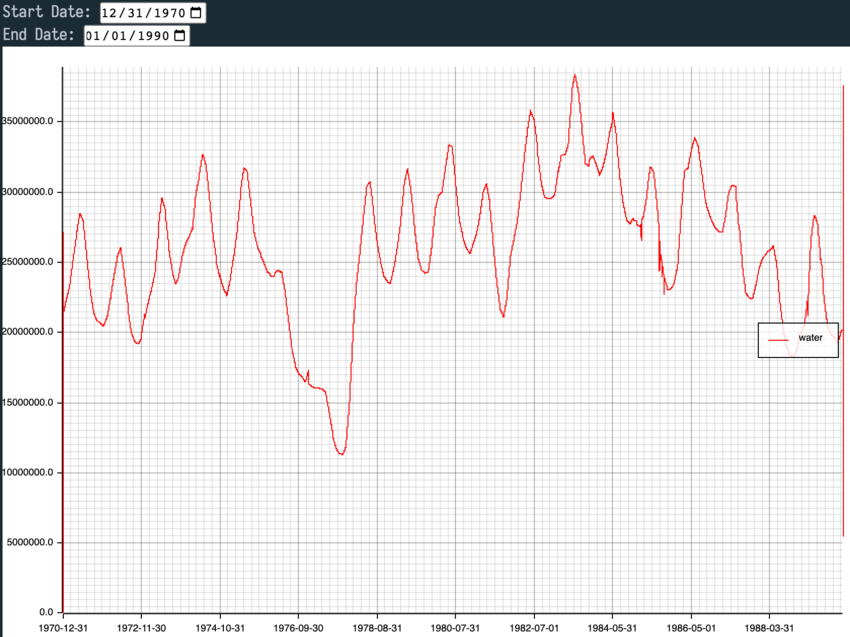
1976 was the fourth driest year on record followed by 1977, the driest year in California recorded. The winter of 1976-77 saw the shift of the PDO. California came very close to austere water measures. 1978 and the years thereafter brought relief with plenty of good rainfall. The Director of Department of Water Resources for the State of California had this to say about the drought in 1978:
Now that the two dry years are past, we must not allow the abundant water supplies of 1978 to lull us into a false sense of security. Droughts do not recur in precise historical sequence or in equal severity. These years 1976 and 1977, together, far exceeded the dryness in our historic prior two-year dry period of record. The experience of the worst earlier drought, covering the seven years from 1928-1934, should be reason enough for Californians not to let up in their water conservation efforts. In the 1928-34 drought, at least one year within the cycle provided near-normal rainfall. The year 1978 may turn out to be a temporary respite, also. Ronald B. Robie, Director of Department of Water Resources for the State of California, 1978
Play with the interactive graph above and adjust the dates! Check out the decade of the 70’s and see the dip for 1976 and 1977.
This interactive graph shows the total amount of water in California’s water reservoirs. This does include two notable reservoirs that the state uses but are outside of California, Lake Mead and Lake Powell along the Colorado River. Note that the water rights for the Colorado river are split amongst several states, Mexico, and Indigenous tribes. I’ve scaled the water totals for these two reservoirs to 27 percent of the reported totals to reflect the approximate amount of water that California has rights to. You can also play with the interactive graph below to see the historical reservoir levels of each reservoir:
One final note to contrast climate change and the PDO event of 1976-77. In 2022 California saw the last of a major drought and the United Kingdom had record breaking heat. The heat in the UK broke the record for the year 1976. Check out this somewhat humorous interview between a newscaster and a meteorological scientist:
This video should give some idea as to how climate change is intensifying the weather events season to season and climates of regions around the world and the wide range of perception of the seriousness to the problems with climate change.
You can use the interactive chart below to see the driest and most recent water years for each reservoir:
California’s water year runs from October 1 to September 30 of the following year (e.g. October 1, 2022 through September 30, 2023) and is the official 12-month timeframe used by water managers to compile and compare hydrologic records.
Generally Speaking…
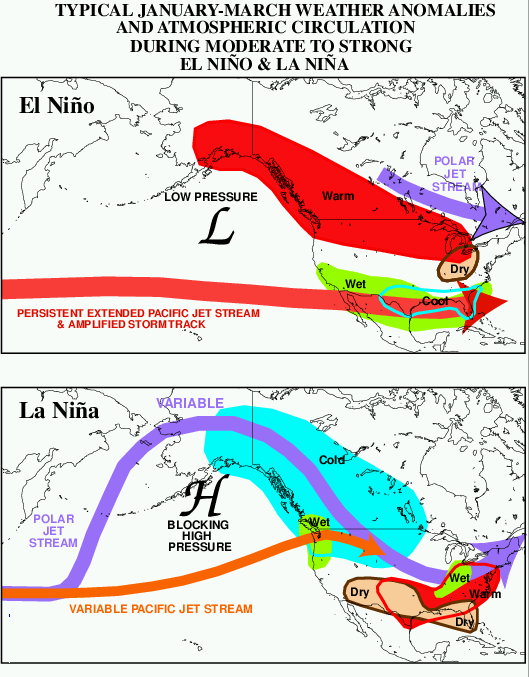
The following statements in this section are generalizations. They are not theorems, dogmas, or rules. There are plenty of variables that affect weather and climate, however the ENSO and PDO are substantial natural climate cycles that can impact weather and climate worldwide - for California they have a tremendous amount of effect in how much water we can collect in our reservoirs. Here are some old rainfall anomaly maps ranging from 1981 to 2010 for El Niños and La Niñas in North America during the months of January through March:
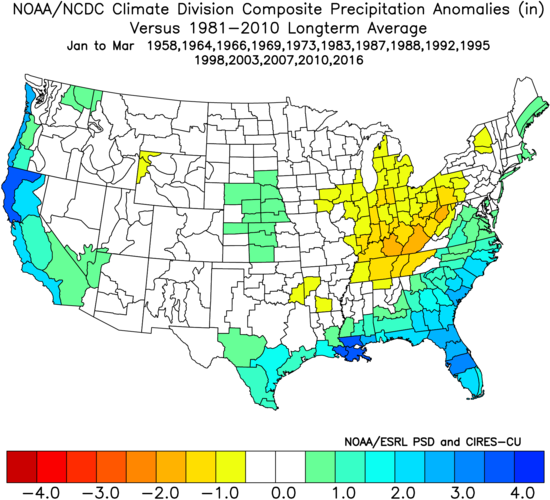
Generally speaking during El Niño events, California is wetter in the Spring. During El Niño years, Californians fare well with water. Similarly, when the PDO is in a warm phase, California tends to do well with rains.
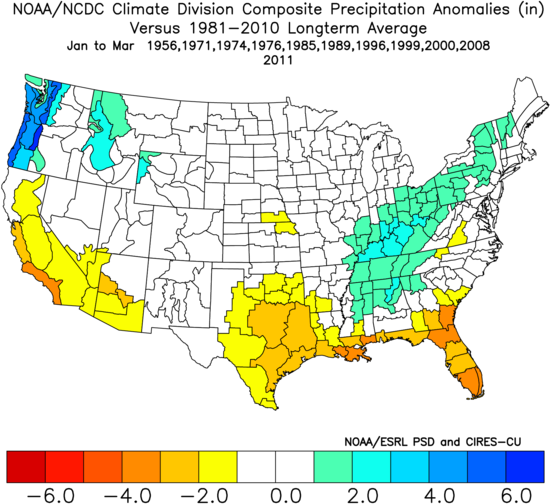
During La Niña years, California is drier in the Spring, in what would usually be California’s rainy season; and during cooler PDO cycles, it is also drier. During La Niña years and cooler PDO years, California struggles with water. Below is an old graphic from NOAA showing the effects of ENSO in each cycle:
Clinton’s “Dire” Warning
Since the ENSO oscillates between El Niño and La Niña events, and climate change exacerbates these events, leading to the aridification of California, it would behoove California to become more resilient to drought events sooner rather than later. Water rationing can lead to dire consequences not just to survival but long term prospects for a region. I don’t mean to be doom and gloom but California has a population of nearly 40 million at the time of writing and produces some 25 percent of the agricultural output of the United States. It’s not going to end well for governance or society in California, the United States or the world if California does not manage its water well enough to last through the toughest expected scenarios for drought in this century if the 40 million are impacted or fields are forced to fallow leading to loss of agricultural output and impacts to the food supply.
Running out of water is not the same as say running out of gas or toilet paper.
What could happen before the most dire situation?
Let’s take a look at recent history!
When water is scarce, the most immediate tool any water management agency has is to ration water. From 2015 to 2018 Cape Town, South Africa experienced a drought where water rationing for urban and agricultural use ramped up. Cape Town was on the verge of having its entire population stand in lines with buckets to get water; that is to say: their plumbing and water supply would have been so low that it would not be reasonable to have the water flow to homes and elsewhere as it normally would. Leading up to that point Cape Town had put in place several “levels” of water rationing, from limiting how one waters lawns, recommendations of flushing toilets with gray water, and providing guidelines of how much water a person or household can use in a day.
Let’s imagine for a second how might Californians manage water rationing:
- Do you see the greater Los Angeles Basin, or the San Francisco Bay Area following water rationing guidelines of daily water use? What about other major metropilii or rural areas of the state?
- Are municipalities and water districts in California capable of reasonably enforcing water rationing?
- Some water districts in the Central Valley do this well but other districts I have doubt they can reasonably enforce well enough to quell very dire situations.
- Does the state begin to ban the watering of water intensive crops such as alfalfa and almonds? Would California try to exhaust the ground water as much as possible to try to “fish itself out” of water shortage?
- Later in this blog, I show a high level estimate of how much water is used to water the almond trees in California.
- If things go sour, i.e. water is rationed to the large and small metropolii of California, how would cities manage distribution of water when it is not adequate to distribute water through plumbing normally? Would Californians stand in line with buckets at designated sites much like what could have happened in Cape Town?
Check Out Part 3
Check out Part 3 of this blog series on California Water Reservoirs! We’ll scratch the surface of agricultural consumption of water and what we can imagine with conserving water.
References
- Pictures come from weather.gov
- data from the interactive chart is derived from CDEC
- Cape Town Drought links: (1) https://time.com/cape-town-south-africa-water-crisis/ (2) https://www.preventionweb.net/files/63935_capetowndraftwaterstrategy2019publi.pdf
- See links within the blog for references on PDO and ENSO
- Estimated Use of Water in the United States County-Level Data for 2015