Before I Begin, Let’s do a TLDR of Things We Can Advocate For
Allow me to outline what policymakers can do right away:
- Municipalities should fund stormwater capture and detention infrastructure that can feed into wastewater facilities.
- The State should accelerate the timeline of their objectives in Gavin Newsom’s Water Resilience Portfolio and 2022 Water Supply Strategy to quell any potential severe drought that ensues before 2030. i.e. The state assembly and senate should legislate and fund wastewater and stormwater projects to match the cadence of drought cycles and not arbitrary decadal timelines. Nature doesn’t know what a decade is.
- House Representatives and Senators should add supplemental funding at the federal level to support the state and municipalities’ stormwater and wastewater infrastructure initiatives.
The goal in the end is to make sure that the stormwater and wastewater facilities in California can integrate with California water supplies through the various water districts and water reservoir systems. The more storm and wastewater recycling capability California has, the more resilient Californians in the major metro areas will be in droughts and climate change’s aridification this century. This will also make urban areas less susceptible to any potential water rights fights that could come in severe droughts.
As for agrarian Californians, we should consider more subsidies and investments in agrivoltaics and irrigation strategies that minimize flood irrigations that come from our water reservoirs and ground water.
To read more about policies on California’s water supply, skip ahead to Part 4 in this blog series. Part 2 will cover the major oceanic climate systems that affect California’s precipitation and water cycles; Part 3 covers drought and aridification in California.
With that out of the way, let’s talk about California’s Water Reservoirs and how I got interested in all of this!
Why Did You Make All Of This?
I wanted to teach myself Rust and use WebAssembly, learn about California’s water supply, and get some idea of how prone California is to the risk of drought - especially during La Niña years.
During the height of the pandemic I would sometimes drive down I-5 highway in the Central Valley to Los Angeles from the Bay Area. One trip seemed a bit surreal with the weather just constantly 100+F (37+C) degree weather throughout the drive which seemed completely unsustainable to grow much; and yet, the Central Valley produces about twenty-five percent of the US’s food supply! This got me thinking about the water used to grow all this food in the Central Valley.
California has a neat data service, California Data Exchange Service (CDEC), which provides some charts and data about the water levels of the water reservoirs and snow packs. Much is left to be desired from what information is presented on CDEC as-is.
This post will go into some of the math involved with the data portrayed in some of the graphs and explain why on earth the graphs are slow.
The Rust and the WASM
When I first started this project, I was absolutely fascinated with what was possible with WASM and how this might work with a blog deployed on a static website host that is Github Pages. I figured to have as much of this done in rust and compiled in WASM. Of course there is the way I did this and the right way of doing this. These did not overlap. Hopefully this helps someone out there that takes this as a shared experience on how not to burden client side compute.
Why are these graphs and table so slow?
- Compression: Your browser, phone, or whatever device you’re using to view this page is doing quite a lot of things. In the WASM blobs on this page and the others in this blog series, there are one of two CSV files compressed as an XZ tar archive. XZ is great for compression but is quite slow at decompression and compute heavy. Ouch. Not a great choice for any visitor to this blog. If compression is your jam, checkout the story of Yann Collett on episode 88 of this corecursive podcast.
clone(): I am duplicating data all throughout my codebase and this is really expensive with respect to memory and compute time. Your device/browser is making duplicate copies of the reservoir data throughout the process of making the charts and that is memory intensive and also takes time. I am definitely fighting the rust ownership model needlessly but I have learned quite a bit about rust through this process!
These are the two primary things that are slowing things up here. There are some console outputs for debugging things which also snag things a tad bit and sometimes perceptible.
The Data
CDEC provides a CSV service to query reservoir data in either daily or monthly measurements, for example here is a sample of data for the first ten days of 2023 for the Oroville reservoir:
STATION_ID,DURATION,SENSOR_NUMBER,SENSOR_TYPE,DATE TIME,OBS DATE,VALUE,DATA_FLAG,UNITS
ORO,D,15,STORAGE,20230101 0000,20230102 0000,1315524, ,AF
ORO,D,15,STORAGE,20230102 0000,20230103 0000,1343148, ,AF
ORO,D,15,STORAGE,20230103 0000,20230104 0000,1365415, ,AF
ORO,D,15,STORAGE,20230104 0000,20230105 0000,1386544, ,AF
ORO,D,15,STORAGE,20230105 0000,20230106 0000,1443537, ,AF
ORO,D,15,STORAGE,20230106 0000,20230107 0000,1486814, ,AF
ORO,D,15,STORAGE,20230107 0000,20230108 0000,1517044, ,AF
ORO,D,15,STORAGE,20230108 0000,20230109 0000,1550501, ,AF
ORO,D,15,STORAGE,20230109 0000,20230110 0000,1617868, ,AF
ORO,D,15,STORAGE,20230110 0000,20230111 0000,1679976, ,AF
The important bits of data are the observation date and the value (i.e. the measurement of water recorded at the reservoir in acrefeet). An acrefoot is 1 foot tall by 66 feet by 660 feet cuboid of water. That’s about 271,330 gallons or 2,718,000 pounds of water. Why America persists to use these obtuse units of measurements still is beyond me.
Sometimes the data has gaps in days, or for very old data (observations can go as far back as 1925) that is only recorded monthly. Lake Powell and Lake Mead are also only recorded monthly.
Note that sometimes the most recent data (e.g. the data from 24 or 48 hours ago) may take some time to get reported to CDEC. In which case, viewing data that is most recent might be a bit underreported like in the “Total Water Reservoir Levels” graph later on in the post.
The Math
So how do we “fill in” gaps in data? Linear interpolation. Nothing fancy! It would be neat to model reservoirs a bit better but for the purpose of having a smooth data set, linear interpolation should do just fine.
The Water
Total Water Reservoir Levels
This is the amount of water that California has in its water reservoirs.
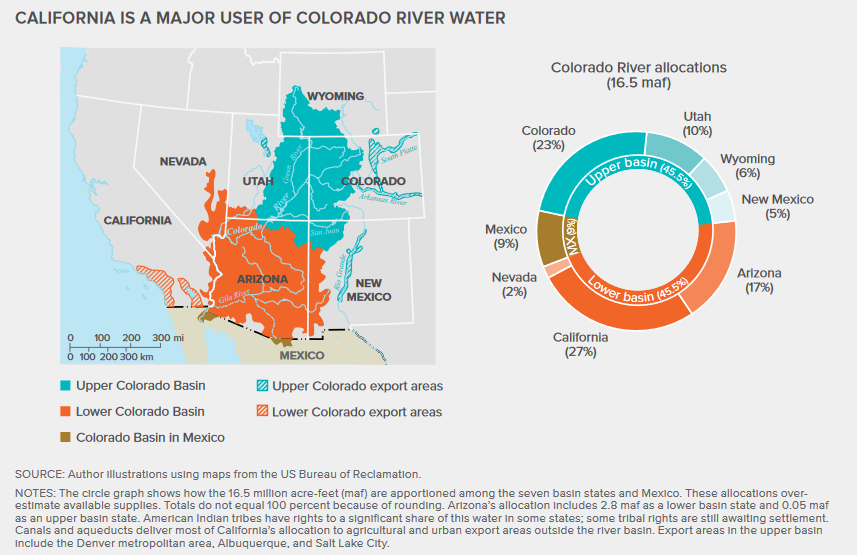
California’s percentage of water rights for the Colorado river is about 27 percent. In the interactive graph above I have scaled Lake Powell and Lake Mead’s water capacity to 27 percent each to reflect this. The image below depicts the allocation of water rights to the Colorado River [pdf].
The Water Years
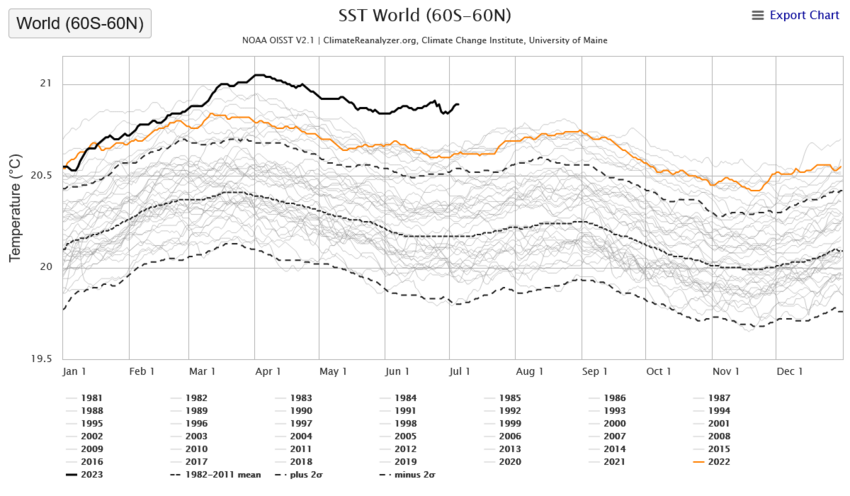
The chart above is by far my favorite and what I think is the most “climate science-y” because it’s not uncommon to see climate science papers with charts that overlay annual cycles of measurements for comparison to observe changes over time and seasons, e.g. this picture below from Climate Reanalyzer shows the average sea surface temperatures by year overlayed with each other:
Okay back to “The Water Years” chart. The chart breaks down the water reservoir data by water years. California’s water year runs from October 1 to September 30 of the following year (e.g. October 1, 2022 through September 30, 2023) and is the official 12-month timeframe used by water managers to compile and compare hydrologic records. For each reservoir, it allows one to view the 20 driest water years on record and the 20 most recent water years on record.
I challenge you!
Using “The Water Years” tool, can you determine which reservoirs are managed by the state and which observe a cyclical behavior that grows in the rainy seasons (Spring) and shrink in the drier seasons (Summer)? Need a hint? Take a look at this map the California Department of Water Resources:
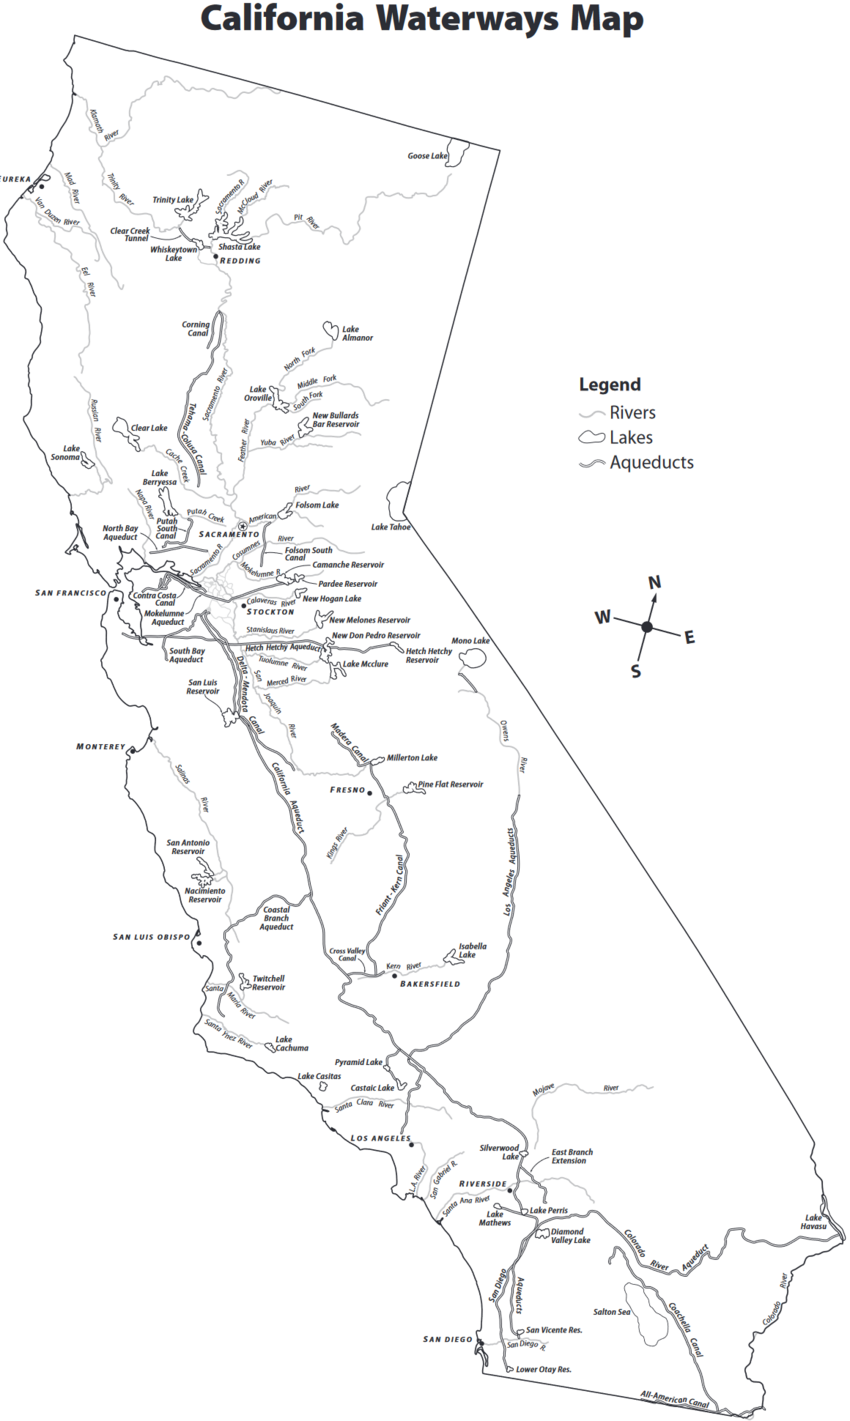
- Some reservoirs do not follow seasonal precipitation cycles and their water levels are managed by the state through the canal systems!
- Take a look at the reservoirs on the map and see which ones are fed by canals. Sometimes they’re drained rather quickly or kept full for lengthy periods of times (see
San Luis - SLFin the driest years).
Historical Water Levels by Reservoir
The chart below simply shows the acrefeet of water for each reservoir over time. A fairly straightforward chart.
Take a look at Lake Mead and Lake Powell. Those lakes along the Colorado River are not looking great at the moment. For extra credit, adjust the dates to the most recent 20 years and see if the heavy precipitation in 2023 have helped things in the most recent droughts. It’s not a pretty picture.
Water Year 52-week Highs and Lows
Before I show you this table, here’s a link to the next blog post about California’s water supply and water reservoirs: click here.
For each reservoir and each water year, this table identifies the date of the highest acrefootage measurement and lowest acrefootage measurement. Note that for the most recent calendar year, the results may vary as the water year completes.